Setup VSCode to run and debug C / C++ code

By the end of this short guide, you’d be able to run, debug, and get IntelliSense for C/C++ files in VSCode. Though, this guide is focused on the Windows platform but can be extended to Mac and Linux with some minor changes.
I extensively used C & C++ in my competitive programming years and wanted better support for debugging & IntelliSense. The only options available were Dev-C++ (outdated) and the original "Mammoth" Visual Studio. Lately, I found VSCode and fell in love with it (first love was Atom). I tweaked it around and set it up as a complete IDE For small C, C++ projects especially geared towards competitive programming.
Create a sample C/C++ project
-
Open/Create an empty folder in VSCode.
-
Create a
new.cppfile inside it like below:#include <iostream> using namespace std; int main() { cout << "Hello World" << endl; // uncomment below line to stop cmd from exiting immediately in case of "externalConsole": true //system("pause"); return 0; } -
Install recommended C/C++ extension in VSCode and reload.
Official C/C++ Extension for VSCode
Install C/C++ Compiler
C/C++ extension does not include a C++ compiler. So, you will need to install one or use which is already installed on your computer.
Windows: Download MinGW64.zip (latest release) and extract it to the C Drive.
Mac: xcode
Linux: gcc
Also, Make sure to add C++ compiler PATH to environment variable of your platform. For Windows MinGW64 add: C:\MinGW64\bin
Run and Debug C/C++ Code
You’ll notice that there is also a .vscode folder in your sample project. To configure debug configuration, 2 files are required launch.json and tasks.json inside .vscode folder.
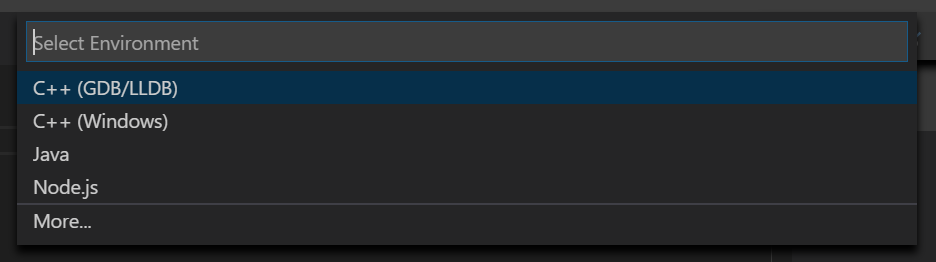
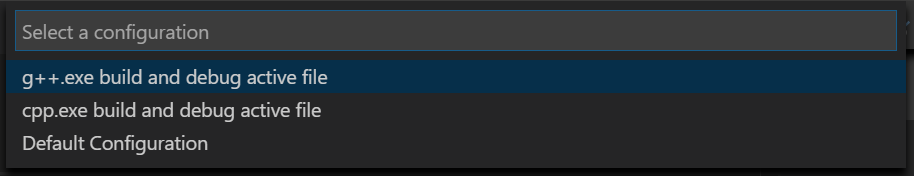
VSCode can create and auto-configure these files if we try to debug for the first time. To do that, open C++ file in VSCode and either hit F5 or go to Debug -> Start Debugging and select C++ (GDB/LLDB) then select g++.exe build and debug active file.
This should create 2 files launch.json and tasks.json in .vscode folder which should look like below (update the MinGW64 path if not correct)
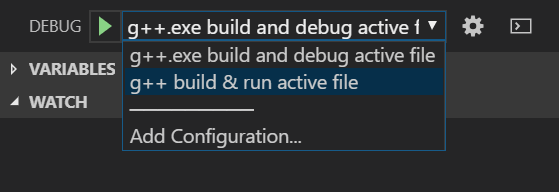
Notice that I’ve added one more optional configuration g++ build & run active file in launch.json and g++ build & run in tasks.json file for purpose of also Running C/C++ code without debugging. Now you may choose which configuration to pick when you start debugging. You may remove the configuration whichever you won’t need.
launch.json
{
  "version": "0.2.0",
  "configurations": [
    {
      "name": "g++.exe build and debug active file",
      "type": "cppdbg",
      "request": "launch",
      "program": "${fileDirname}\${fileBasenameNoExtension}.exe",
      "args": [],
      "stopAtEntry": false,
      "cwd": "${workspaceFolder}",
      "environment": [],
      "externalConsole": false, //set to true to see output in cmd instead
      "MIMode": "gdb",
      "miDebuggerPath": "C:\MinGW64\bin\gdb.exe",
      "setupCommands": [
        {
          "description": "Enable pretty-printing for gdb",
          "text": "-enable-pretty-printing",
          "ignoreFailures": true
        }
      ],
      "preLaunchTask": "g++.exe build active file"
    },
    {
      "name": "g++ build & run active file",
      "type": "cppdbg",
      "request": "launch",
      "program": "${fileDirname}\${fileBasenameNoExtension}.exe",
      "args": [],
      "stopAtEntry": false,
      "cwd": "${workspaceFolder}",
      "environment": [],
      "externalConsole": false, //set to true to see output in cmd instead
      "MIMode": "gdb",
      "miDebuggerPath": "C:\MinGW64\bin\gdb.exe",
      "setupCommands": [
        {
          "description": "Enable pretty-printing for gdb",
          "text": "-enable-pretty-printing",
          "ignoreFailures": true
        }
      ],
      "preLaunchTask": "g++ build & run active file"
    }
    ]
}
tasks.json
{
  "tasks": [
    {
      "type": "shell",
      "label": "g++.exe build active file",
      "command": "C:\MinGW64\bin\g++.exe",
      "args": [
        "-g",
        "${file}",
        "-o",
        "${fileDirname}\${fileBasenameNoExtension}.exe"
      ],
      "options": {
        "cwd": "C:\MinGW64\bin"
      }
    },
    {
      "type": "shell",
      "label": "g++ build & run active file",
      "command": "C:\MinGW64\bin\g++.exe",
      "args": [
        "${file}",
        "-o",
        "${fileDirname}\${fileBasenameNoExtension}.exe"
      ],
      "options": {
        "cwd": "C:\MinGW64\bin"
      }
    }
  ],
  "version":"2.0.0"
}
externalConsole in launch.json can be set to true to see code output in cmd instead.
Restart VSCode to take effects of newly added compiler paths.
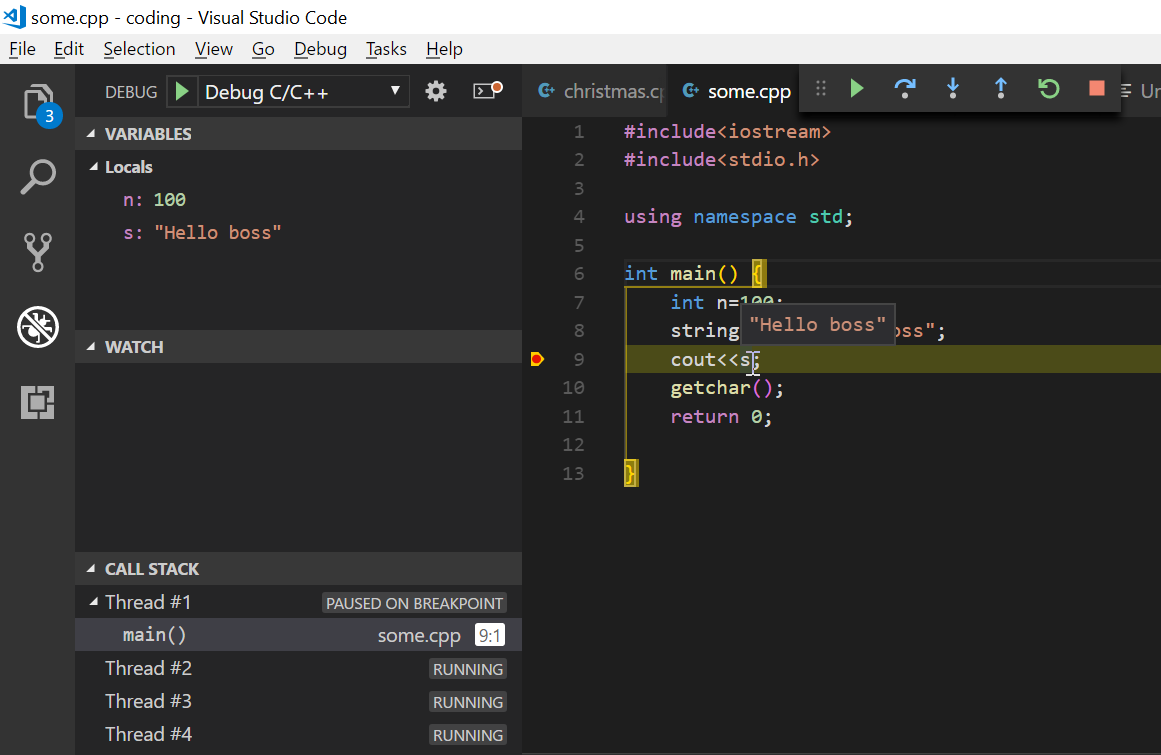
Open any C/C++ file, set some breakpoints (or not), and hit the Big Green Play Button.
(Shortcut to debug: F5 )
Tip: To hide *.exe files in the side explorer of VSCode, open settings and paste the below config:
"files.exclude": {
 "*.exe": true
 }